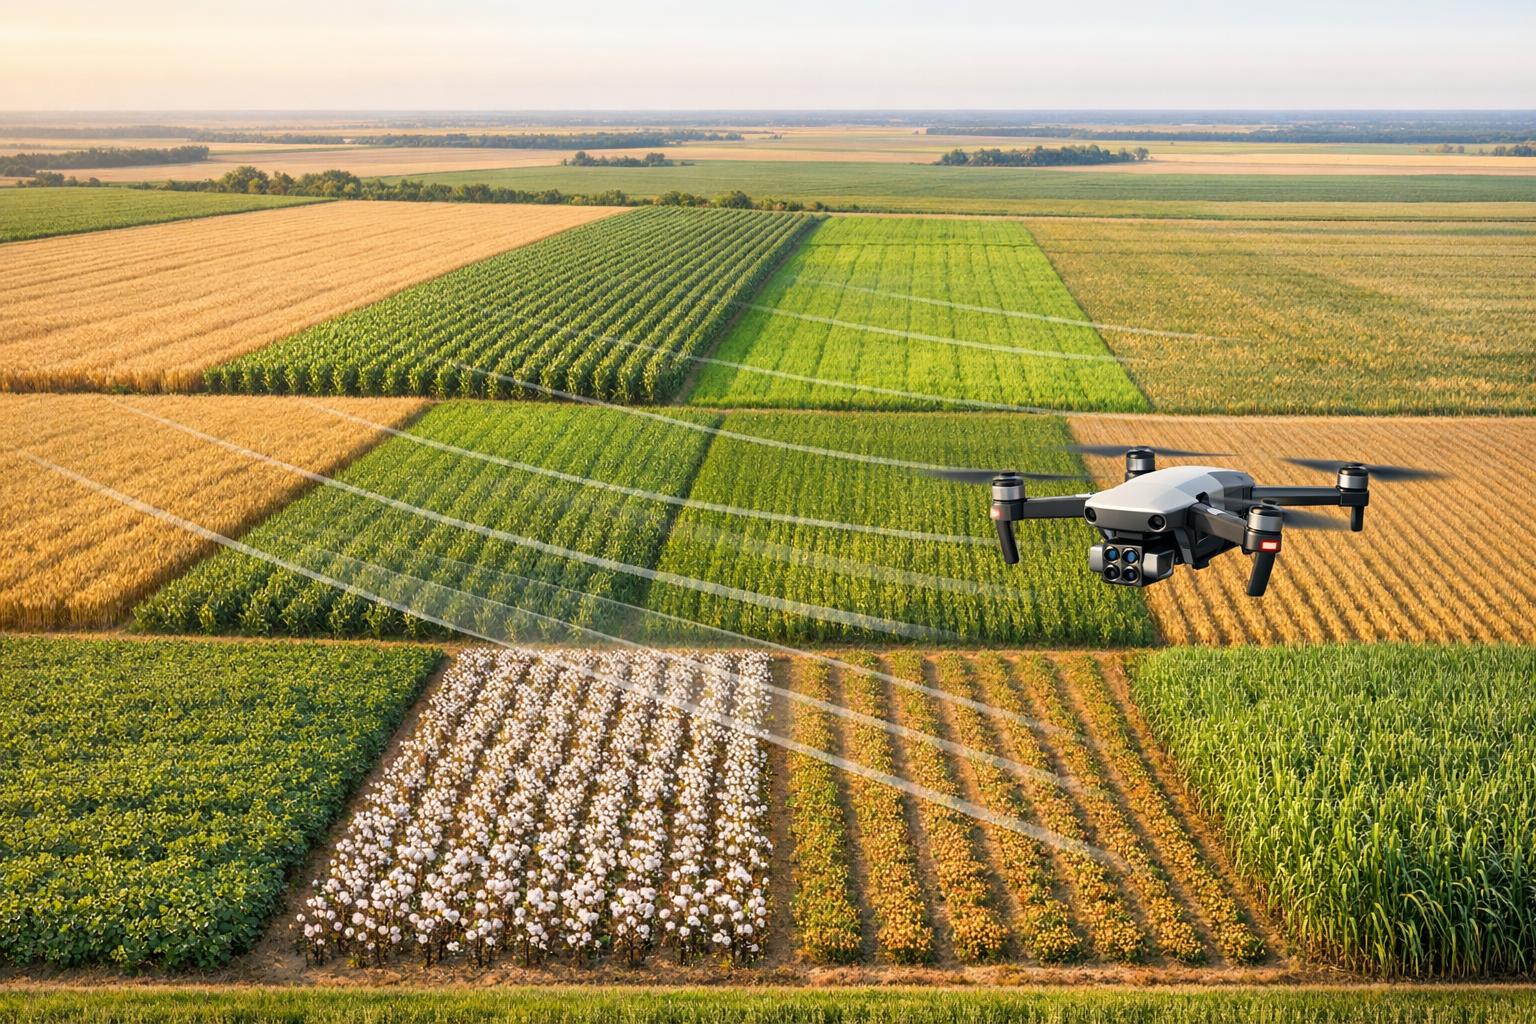
Drones are transforming how farmers predict crop yields. By using advanced sensors and machine learning, UAVs (Unmanned Aerial Vehicles) offer precise, early insights into harvest volumes. This technology is especially effective for crops like wheat, peanuts, corn, rice, soybeans, cotton, and sugarcane.
Key Points:
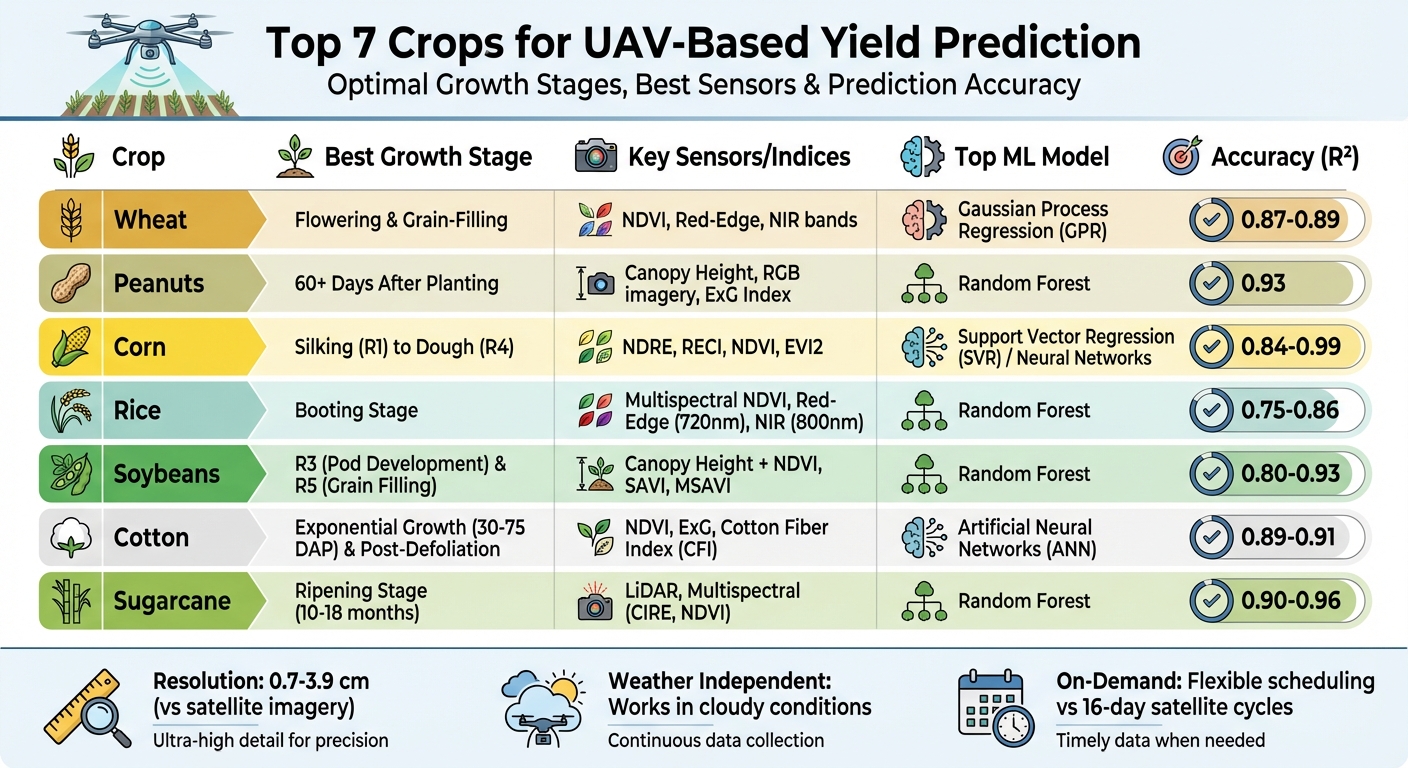
- Wheat: NDVI and red-edge bands are highly accurate during flowering and grain-filling stages.
- Peanuts: Above-ground indicators like canopy height help estimate underground pod yields.
- Corn: Red-edge indices like NDRE excel during silking and dough stages.
- Rice: Multispectral data is most effective during the booting stage.
- Soybeans: Combining canopy height and vegetation indices improves predictions during R3 and R5.
- Cotton: Boll counts and NDVI are reliable, especially post-defoliation.
- Sugarcane: LiDAR and multispectral sensors track height and sucrose levels during ripening.
Drones outperform satellites in resolution, flexibility, and accuracy, making them indispensable for precision agriculture. Farmers can now make better decisions, reduce costs, and maximize productivity with this cutting-edge approach.
UAV-Based Yield Prediction Guide: 7 Crops with Optimal Growth Stages and Accuracy Metrics
1. Wheat
High Correlation with UAV-Derived Data
UAV-derived NDVI (Normalized Difference Vegetation Index) shows a strong link to wheat yield, especially during the late grain-filling stage, with an impressive R² = 0.89. Under full irrigation, NDVI correlations range between R² = 0.40 and 0.49, but these values drop significantly under limited irrigation conditions, falling to R² = 0.08–0.14. Among the spectral bands, the Red-edge (RE) and Near-infrared (NIR) bands are particularly effective for predicting yield and maturity. For instance, the NDRE (Normalized Difference Red Edge) index has demonstrated prediction errors as low as 49.1 g/m² in European wheat trials. These findings highlight how targeted growth stages can further enhance prediction accuracy.
Optimal Growth Stages for Yield Prediction
The flowering and grain-filling stages provide the most reliable data for yield predictions. At the Tongshan experimental station in Xuzhou City, China, researchers used a DJI Phantom 4 RTK Multispectral UAV to gather data from 119 "Xumai-33" wheat quadrats in 2021. The filling stage alone delivered the highest prediction accuracy, but combining data from both the flowering and filling stages improved predictions to R² = 0.88. In contrast, early-stage tillering predictions remain difficult due to the tiny size of developing grains, which are often hidden by stems.
Performance of Machine Learning Models
In the Xuzhou study, Gaussian Process Regression (GPR) emerged as the top-performing model, achieving R² = 0.87 and RMSE = 49.22 g/m² when using multispectral indices. This outperformed Support Vector Regression (SVR), which reached around 0.82, and Random Forest Regression (RFR), which achieved approximately 0.80. For hyperspectral data, Partial Least Squares Regression (PLSR) was the most effective, with an RMSE of 948.88 kg/hm², surpassing both Random Forest and Neural Networks. Interestingly, PLSR achieved better results using only the top three vegetation indices, while Random Forest required eight features to perform optimally. These findings underscore how advanced models, when paired with multispectral data, can significantly improve prediction accuracy.
Application of UAV Data Types
Multispectral imagery remains the cornerstone for wheat yield prediction. Sensors capturing visible, Red-edge, and NIR bands provide the most practical results. For example, during the 2021 and 2022 growing seasons at the Technical University of Munich in Freising, Germany, Random Forest models applied to multispectral UAV data delivered consistent results across both years. Additionally, texture features derived from multispectral imagery - such as Contrast and Dissimilarity - enhance variety classification, achieving accuracies between 88% and 92%.
sbb-itb-ac6e058
2. Peanut
Challenges in UAV-Based Yield Prediction
Peanuts pose a unique challenge for UAV-based yield prediction because their pods develop underground. After the plant's "pegs" (gynophores) grow downward into the soil, the pods form beneath the surface. As N. Ace Pugh from the USDA-ARS Crop Stress Research Laboratory explains, "This subterranean growth, while advantageous for the plant in terms of accessing vital soil nutrients, makes non-invasive yield estimation incredibly challenging". To estimate yield, researchers rely on above-ground indicators like canopy cover, canopy height, and vegetation indices as proxies for what’s happening underground.
Insights from Multitemporal Data Collection
Accurate peanut yield predictions depend on collecting multitemporal data rather than relying on single-point measurements. Between May and September of 2021 and 2022, researchers at the USDA-ARS Crop Stress Research Laboratory in Lubbock, TX, used a DJI Mavic 2 Pro to conduct 12 flights in 2021 and 18 flights in 2022, covering 73 unique peanut genotypes. By analyzing sigmoidal growth curves, they extracted 14 latent phenotypes, such as maximum growth rate and the canopy expansion inflection point. These phenotypes provided a deeper understanding of plant vigor and yielded more accurate predictions than single measurements could offer.
Performance of Machine Learning Models
In the Lubbock study, Random Forest models stood out with an R² of 0.93, surpassing eXtreme Gradient Boosting (XGBoost), which achieved an R² of 0.88. N. Ace Pugh highlighted this performance, noting, "the random forest model exhibited exceptional predictive accuracy (R² = 0.93), while XGBoost was also reasonably effective (R² = 0.88)".
Timing and Strategies for Data Collection
The timing of data collection plays a crucial role in predicting peanut yield. Remote sensing methods can achieve about 80% accuracy but generally perform poorly until at least 60 days after planting (DAP). As the crop matures, the improved detectability of the chlorophyll a to b ratio in leaf reflectance significantly boosts model accuracy. UAV flights should be scheduled between 10:00 AM and 2:00 PM to take advantage of solar noon, minimizing shadows and ensuring consistent lighting conditions. Even without multispectral sensors, RGB imagery combined with metrics like the Excess Green Index (ExG) can deliver highly effective predictions. These optimized strategies lay the groundwork for advanced UAV-based yield prediction methods discussed further in this article.
3. Corn
High Correlation with UAV-Derived Data
Corn, like other major crops, benefits significantly from UAV-based multispectral imaging. Its growth patterns are highly predictable, with spectral indices often achieving R² values above 0.80 during key reproductive stages. Among these indices, NDVI (Normalized Difference Vegetation Index) and EVI2 (Enhanced Vegetation Index 2) provide the most consistent results when data is gathered during these critical stages. For corn specifically, red edge-based indices like NDRE (Normalized Difference Red Edge) and RECI (Red Edge Chlorophyll Index) are particularly useful. These indices maintain sensitivity to chlorophyll levels without becoming saturated, even in dense canopies.
In addition to spectral data, physical parameters like digital plant counts (correlation: 0.94) and canopy cover (correlation: 0.77) also align closely with corn yield outcomes. When these parameters are combined with vegetation indices and processed through neural networks, correlation coefficients can reach as high as 0.99 during the V8 growth stage, which occurs roughly 47 days after planting. These strong correlations pave the way for precise yield predictions at critical points in the growing season.
Optimal Growth Stages for Yield Prediction
The best time for yield predictions in corn lies between the silking (R1) and dough (R4) stages. At the Musgrave Research Farm in Aurora, NY, researchers discovered that NDVI and EVI2 readings collected during the R4 stage produced R² values exceeding 0.90 - provided nitrogen was applied through sidedressing before the V6 stage. As Sunoj Shajahan and colleagues note:
"Accurate yield estimates can be obtained using NDVI and EVI2, as long as there is an N-rich strip in the field, sidedressing is performed prior to V6, and sensing takes place at R3 or R4".
However, prediction accuracy drops significantly after R4 due to canopy yellowing during senescence, which disrupts spectral reflectance signals. Early-season predictions, though less precise, still offer valuable insights for management decisions. For example, a 2021 study conducted at the USDA-ARS Crop Production Systems Research Unit in Stoneville, MS, achieved an R² of 0.84 at the V6 stage using Support Vector Regression (SVR). This demonstrates that multi-stage predictions are feasible, even with smaller datasets.
Performance of Machine Learning Models
When it comes to machine learning models, Support Vector Regression (SVR) and k-Nearest Neighbor (KNN) often outperform Random Forest (RF) in scenarios with limited data. At the USDA-ARS facility in Stoneville, SVR achieved an R² of 0.84 at the V6 stage and 0.83 at R5, surpassing both RF and Deep Neural Networks. One major drawback of Random Forest is its tendency to overfit spatial structures. For example, in a 2021 study at the Area X.O smart farm in Ottawa, Canada, RF achieved a correlation coefficient of 0.81 with standard 10-fold cross-validation. However, this dropped to just 0.39 when spatial cross-validation was applied.
XGBoost has also proven to outperform methods like LASSO regression, ridge regression, and RF in certain experiments. For operations requiring the highest levels of accuracy, artificial neural networks stand out. These models excel at integrating spectral and physical data, with some studies reporting correlation coefficients between 0.97 and 0.99 when combining vegetation indices with plant density and canopy cover data.
Application of UAV Data Types
Multispectral imagery consistently outperforms standard RGB cameras because Near-Infrared (NIR) and Red Edge bands have stronger correlations with leaf chlorophyll and biomass compared to visible bands alone. However, RGB-based indices like Excess Green (EXG) and Triangular Greenness Index (TGI) can serve as cost-effective alternatives in early vegetative stages (before V4), though they generally provide lower accuracy.
For reliable results, follow standard flight timing protocols to ensure consistent sensor readings. Including an N-rich strip (areas with excess nitrogen applied at planting) offers a reference point for calibration, significantly improving model accuracy. UAVs also provide advantages over satellites, such as centimeter-level spatial resolution and flexible data collection schedules. Unlike satellites, which are limited by cloud cover and fixed 16-day revisit cycles, UAVs are ideal for precision mapping within fields.
4. Rice
High Correlation with UAV-Derived Data
Predicting rice yields often depends on multispectral indices that use red-edge (720 nm) and near-infrared (800 nm) bands, which perform better than RGB indices. During the booting stage, multispectral NDVI achieves an R² of 0.75, and combining NDVI data from booting and heading stages slightly improves this to R² = 0.76. However, NDVI tends to saturate in dense canopies, making it hard to differentiate yields in high-performing crops. Red-edge vegetation indices address this issue by staying sensitive even in thick canopies.
As rice reaches the ripening stage and leaves start to wither, vegetation indices lose their predictive power. At this point, spatial and textural features from high-resolution RGB imagery become more reliable, offering accurate predictions when traditional indices fall short. These findings highlight the importance of selecting the right growth stages for accurate yield predictions.
Optimal Growth Stages for Yield Prediction
The booting stage stands out as the best single growth stage for predicting rice yields. According to research published in the ISPRS Journal of Photogrammetry and Remote Sensing:
"The booting stage was identified as the optimal stage for grain yield prediction with VIs at a single stage for both digital image and MS image".
From January to June in 2022 and 2023, a study in Lambayeque, Peru, conducted by researchers from the Universitat Politècnica de València and the National Agrarian University La Molina, used a DJI Matrice 300-RTK UAV equipped with Micasense RedEdge-MX and Parrot Sequoia sensors to monitor 37 subplots. By integrating spectral indices (NDVI, NDRE) with textural features (GLCM), they achieved an R² of 0.78 for yield prediction during the dough stage in 2022.
The heading stage presents its own set of challenges. Panicle emergence during this phase creates mixed spectral signals, reducing accuracy unless corrected with Spectral Mixture Analysis (SMA). For late-season predictions close to harvest, combining spectral indices with textural features like Energy, Entropy, and Correlation helps overcome the limitations posed by withering vegetation.
Performance of Machine Learning Models
Machine learning models, powered by precise spectral data, significantly improve prediction accuracy. Among these, Random Forest consistently delivers the best results. In 2023, researchers at Yanjiagang Farm in Heilongjiang Province, China, tested four rice varieties (KY131, SJ22, CY31, TLY619) under six nitrogen levels. They found that Random Forest algorithms at the heading stage provided the most accurate yield predictions, achieving R² = 0.86 with an RMSE of 0.59 t/ha.
In another study conducted in July 2025 at the ICAR-Central Rice Research Institute in Cuttack, India, researchers used 25 vegetation indices derived from UAV-mounted RGB sensors. Here, Random Forest outperformed three other models, predicting yields in the range of 3.16–5.50 t/ha with an RMSE of 0.27 t/ha. The study identified coloration (CI), hue (H), and intensity (I) as the most critical factors for accurate yield predictions.
For even better results, ensemble models push accuracy further. A Bayesian Model Averaging (BMA) model, for instance, achieved a correlation coefficient of 0.958 and an RMSE of 0.187 t/ha during the ripening stage by combining the strengths of multiple models. Incorporating phenotypic parameters like Leaf Area Index and Canopy Cover - alongside vegetation indices - improves model reliability, often achieving correlations above 0.85.
Application of UAV Data Types
While multispectral sensors generally outperform RGB cameras, RGB sensors remain a cost-effective choice for broader regional monitoring. When processed using Convolutional Neural Networks (CNNs), RGB data can capture spatial-spectral features, excelling during the ripening stage when traditional vegetation indices fall short.
For multispectral sensors, prioritizing hardware that captures the red-edge band is crucial for maintaining sensitivity in dense canopies. To maximize accuracy, schedule UAV flights during the booting stage for single-point predictions or combine spectral data from both the booting and heading stages to achieve even higher R² values.
5. Soybean
High Correlation with UAV-Derived Data
UAV-derived vegetation indices like Canopy Cover (CC), NDVI, and Normalized Area Vegetation Index (NAVI) show a strong connection to soybean yield. Higher values in these indices typically mean better yields. A January 2020 study by São Paulo State University (UNESP) on a 2.4-hectare rainfed soybean farm demonstrated that combining Canopy Height Models (CHM) with spectral data improved prediction accuracy, achieving a Pearson's correlation of 0.91 with just a 1.5% error rate.
Red-edge spectral bands are particularly useful for identifying different maturity groups, with indices like Dr/Drmin and SDr playing key roles. For early-season predictions, when canopy cover is limited, soil-adjusted indices like SAVI and MSAVI are more effective than NDVI because they reduce soil background interference. Additionally, texture features from high-resolution RGB imagery, analyzed using the Gray Level Co-occurrence Matrix (GLCM), add valuable spatial context to spectral data. These correlations help pinpoint the best growth stages for yield prediction.
Optimal Growth Stages for Yield Prediction
The R3 stage (initial pod development) is the earliest point for reliable yield predictions, while the R5 stage (grain filling) typically offers the highest accuracy before photosynthetic activity declines during senescence. In the 2022 growing season, USDA-ARS and Mississippi State University used a DJI Phantom 4 Multispectral UAV to monitor a soybean field in Pontotoc, MS. By analyzing 14 vegetation indices across eight growth stages, they found R3 to be the best stage for early forecasting. Random Forest models achieved R² values between 0.80 and 0.87 using Canopy Cover and NDVI metrics.
Combining data from multiple stages can further improve accuracy. For example, a study in Jiaxiang County, China, evaluated 275 soybean genotypes using a Cubert UHD 185 hyperspectral sensor. While the flowering stage alone reached an R² of 0.689 with an RMSE of 408.099 kg/ha, combining data from flowering, podding, and bean-filling stages increased the R² to 0.700. Early vegetative stages like V4 can also help assess vigor, though their correlations are generally weaker compared to reproductive stages.
Performance of Machine Learning Models
Random Forest is particularly effective for capturing complex, non-linear relationships in soybean yield predictions. During variety trials by the International Institute of Tropical Agriculture (IITA) in Nigeria, a senseFly eBee X UAV equipped with a Sequoia multispectral camera helped both Cubist and Random Forest models achieve an R² of 0.89.
Gaussian Process Regression (GPR) also performs well in multi-genotype scenarios. By incorporating maturity group data (Early, Median, Late) alongside spectral inputs, GPR models provide stable predictions across diverse genetic profiles. For large-scale breeding, 3D Convolutional Neural Networks (CNNs) offer notable advantages. In Argentina, researchers modified 2D CNN architectures into 3D versions to analyze multitemporal images from 13 fields covering 30,000 plots. Using only RGB imagery, the DenseNet model achieved an R² of 0.69. Another approach, an ensemble bagging-stacking framework combining Lasso, Random Forest, Ridge Regression, and XGBoost with Bayesian Model Averaging, reached an R² of 0.70. The type of UAV data collected can significantly impact these models' accuracy.
Application of UAV Data Types
Multispectral sensors with red-edge and NIR bands are crucial for monitoring crop health. Meanwhile, high-resolution RGB cameras paired with deep learning models, like those used in the 3D CNN study in Argentina, enable precise, non-destructive yield estimates.
Incorporating 3D structural data from LiDAR or oblique imaging with spectral information can enhance accuracy by 3.5% to 8.8%. Cross-Circling Oblique (CCO) photography, for instance, captures canopy structure details that traditional nadir (top-down) imaging might miss, offering a more detailed view of crop development. For smaller datasets, pixel-based augmentation techniques can increase sample diversity, improving model training.
6. Cotton
High Correlation with UAV-Derived Data
UAV (Unmanned Aerial Vehicle)-derived data, such as NDVI (Normalized Difference Vegetation Index), ExG (Excess Green Index), canopy volume, and height, show a strong connection to cotton yield. Researchers at Texas A&M AgriLife Research discovered in November 2020 that canopy volume and ExG alone accounted for about 50% of the predictive power in their yield models. Using multi-temporal data, which tracks growth patterns over time, leads to more reliable yield estimates compared to single-flight data collection.
Imagery taken after defoliation is particularly effective for yield estimation. By calculating the Cotton Fiber Index (CFI) - the ratio of open boll pixels to total pixels - researchers have reported strong correlations with harvested lint yield, with one study showing an R² of 0.69. While NDVI is useful for mid-season growth predictions, it tends to saturate near harvest due to dense vegetation or exposed soil and bolls. Adding spatial texture data to spectral data helps overcome this limitation, improving prediction accuracy. These findings emphasize the importance of identifying key growth stages for accurate yield forecasting.
Optimal Growth Stages for Yield Prediction
The exponential growth phase, which occurs 30–75 days after planting, is critical for predicting cotton yield. During this period, rapid biomass accumulation happens as the canopy expands and reproductive structures like squares and bolls form. UAV-based models have achieved R² values of 0.72 during this stage. Early bloom, or the first flower stage, is especially reliable for early predictions, with plant height measurements showing Pearson correlation coefficients ranging from 0.66 to 0.96 with final yield.
The "cutout" stage, spanning 75–120 days after planting, marks a shift from vegetative growth to boll maturation and fiber development. At Corpus Christi, UAV digital surface models identified the maximum growth rate (Rmax) as a significant predictor, successfully classifying 20 varieties with 80% accuracy. Late-season imagery, taken just before harvest, enables direct boll counting, with linear regression models achieving an impressive R² of 0.913 for yield prediction.
Performance of Machine Learning Models
Artificial Neural Networks (ANNs) have shown superior performance in estimating cotton yields, outperforming Support Vector Regression (SVR) and Random Forest Regression (RFR) models with R² values around 0.89. In November 2020, Texas A&M AgriLife Research developed an ANN framework using multi-temporal UAV data, including canopy cover, height, volume, and NDVI. This approach delivered better results with lower residual errors compared to traditional machine learning models.
Convolutional Neural Networks (CNNs) have also set a high standard for in-season yield predictions. In April 2024, a study by the USDA-ARS Cropping Systems Research Laboratory in Lubbock, Texas, used scale-aware CNN models with UAV RGB imagery. These models surpassed well-known architectures like AlexNet and ResNet, achieving an R² above 0.9 and a mean absolute error of just 3.08 pounds per row.
For models that integrate vegetation indices with texture features, the RF_ELM (Random Forest-based Extreme Learning Machine) model has proven highly accurate. Researchers at Shihezi University in China demonstrated this in June 2022, achieving an R² of 0.9109 and an RMSE of approximately 0.81 tons per acre. This model significantly improved upon those relying solely on vegetation indices.
"Comparison results revealed that ANN model outperforms SVR and RFR." - ISPRS Journal of Photogrammetry and Remote Sensing
These advancements highlight the growing importance of diverse UAV data in precision agriculture.
Application of UAV Data Types
Different types of UAV sensors play distinct roles in cotton yield analysis. Multispectral sensors with red-edge and near-infrared (NIR) bands are essential for monitoring plant health and nitrogen levels throughout the season. Meanwhile, high-resolution RGB cameras are effective for measuring plant height and counting bolls after defoliation. For example, Shihezi University used low-altitude UAV imaging (about 16 feet above ground) with a modified deep learning model (CD-SegNet) to segment cotton boll pixels. This method achieved an average yield estimation error of just 6.2% in high-density cotton fields.
Combining multiple data sources further improves accuracy. The University of Georgia demonstrated this by using an SVM (Support Vector Machine) classifier on aerial RGB imagery to identify cotton pixels at the plot level. Their approach achieved an R² of 0.93 and a mean absolute percentage error of 13.7% when compared to ground truth boll counts. Additionally, multi-temporal sampling - collecting data every two weeks starting five weeks after planting - captures the complete growth curve, delivering the highest accuracy for yield prediction models.
7. Sugarcane
High Correlation with UAV-Derived Data
Sugarcane, like wheat and peanuts, benefits from UAV technology to improve yield predictions. Two types of UAV-derived data are particularly useful: LiDAR for structural insights and multispectral imagery for quality analysis.
LiDAR provides detailed structural data, such as plant height and density, which strongly correlate with aboveground fresh weight (AFW). A study conducted in Fusui County, China, in November 2019 used UAV-LiDAR equipped with the LR1601-IRIS sensor to estimate AFW. The Random Forest Regression model achieved an impressive R² of 0.96 and an RMSE of 1.27 kg/m², outperforming other algorithms like Gradient Boosting Machine (GBM). A LiDAR point density of about 175 points/m² is sufficient to penetrate the sugarcane canopy and accurately measure height.
Multispectral imagery complements structural assessments by focusing on crop quality, such as maturity and nitrogen content. For instance, researchers at São Paulo State University (Unesp) used a DJI Phantom 4 Multispectral in Jaboticabal, Brazil, from February to May 2022. Their Random Forest model achieved an R² of 0.9 for juice Purity and 0.8 for °Brix (soluble solids). Vegetation indices like CIRE (Chlorophyll Index – RedEdge) and NDVI help track crop maturity and nitrogen levels, with leaf nitrogen content predicted at an R² of 0.57.
For a cost-effective alternative, RGB imagery can estimate stalk height and density through Structure from Motion (SfM). Between November 2020 and January 2021, a project in Thailand combined UAV-RGB data with Sentinel-2 imagery. Using UAV-derived plant height in a Random Forest model, researchers mapped regional yields with an RMSE of 6.88 t/ha, closely aligning with government data. Similarly, RGB-based yield estimates showed an RMSE of 6.63 Mg/ha, just 5.18% higher than actual sampling yields.
Optimal Growth Stages for Yield Prediction
Combining sensor data with key growth stages significantly improves yield predictions. The ripening stage is particularly important for qualitative yield forecasting, as sugarcane primarily accumulates sucrose during this phase - typically 10 to 18 months after planting. Structural measurements also become more accurate as the crop matures. For instance, height estimation during the ripening phase has an RMSE of 0.24 m, compared to 0.35 m during the tillering phase. A test farm in Uttar Pradesh, India, demonstrated in February 2024 that a single UAV-derived Digital Surface Model (DSM) captured one day before harvest could predict yield variability with an R² of 0.95.
"Maturation stages provide optimal phenological conditions for multispectral imaging, enabling the most accurate yield and sugar content forecasts." – Marcelo Rodrigues Barbosa Júnior, Department of Engineering and Mathematical Sciences, UNESP
For earlier predictions, the middle growth stage (grand growth) offers a critical window. Between mid-March and early May in the southern hemisphere, indices like NDRE and GRNDVI show strong correlations with final yield, allowing predictions up to six months before harvest.
Performance of Machine Learning Models
Random Forest consistently outperforms other algorithms in both quantitative and qualitative sugarcane yield predictions. It handles non-linear data relationships well and is resistant to noise, even with smaller datasets. In sugarcane quality assessments, Random Forest surpassed algorithms like Support Vector Machine (SVM) and Multiple Linear Regression (MLR) in predicting juice characteristics.
"Random forest most accurately and precisely predicted not only °Brix but also Purity, further supporting its outperformance at learning on spatio-temporal data to map a series of spectral inputs to an agronomic output." – Marcelo Rodrigues Barbosa Júnior, São Paulo State University
However, Gradient Boosting has shown potential in some cases. For example, a study at the Galoya Plantation in Sri Lanka (September 2020–March 2021) used a DJI Mavic Pro to monitor the SRI 128 sugarcane variety. By combining UAV-derived plant height with the Green Leaf Index (GLI) in a Random Forest model, researchers achieved an R² of 0.90 and an RMSE of 0.37 m.
Application of UAV Data Types
Different UAV sensors serve distinct roles in sugarcane monitoring. LiDAR is ideal for structural mapping, such as height and biomass estimation, particularly during later growth stages when the canopy closes. Multispectral sensors are better suited for evaluating crop maturity and sugar quality, especially during the ripening stage. For biomass predictions, UAV surveys are most effective early in the season, around 100–142 days after harvest.
NDVI, while commonly used, can saturate during vigorous growth. In such cases, allometric variables like stalk height and density provide more accurate estimates. Combining structural data (e.g., LiDAR or RGB-derived height) with physiological data (e.g., multispectral vegetation indices) strengthens model accuracy across growth stages. This integrated approach highlights the value of UAV technology in achieving precise and comprehensive yield estimations.
Phenology-Aware In-Season Crop Yield Estimation Through UAV Multispectral Imagery & Deep Networks
Techniques and Best Practices
To make UAV-based yield prediction effective, it's essential to focus on three key areas: choosing the right vegetation indices, selecting the best machine learning models, and timing flights to gather accurate data. These strategies form the backbone of successful yield predictions across different crops.
Vegetation indices play a crucial role, but their effectiveness depends on the crop and biomass levels. For example, the Normalized Difference Vegetation Index (NDVI) is widely used for monitoring crops like wheat, soybeans, corn, and cotton. However, in high-biomass conditions, the Enhanced Vegetation Index (EVI) often performs better, especially for wheat and cotton. Corn benefits significantly from the Normalized Difference Red-Edge (NDRE) index when using multispectral imagery. For soybeans, the Soil-Adjusted Vegetation Index (SAVI) is particularly effective, especially at the V4 growth stage. Rice stands out as a unique case, where RGB-based indices like Coloration (CI), Hue (H), and Intensity (I) prove highly useful when using low-cost sensors. Both SAVI and NDVI are especially reliable for predicting high yields. These indices serve as a foundation for refining predictions through model selection.
Machine learning models also make a big difference in prediction accuracy. Models like Random Forest (RF) and Convolutional Neural Networks (CNN) consistently deliver strong results across various grain crops. For scenarios with limited data, Support Vector Regression (SVR) is a solid choice. Beyond selecting the right model, careful planning of UAV flights is essential for capturing high-quality data.
Flight timing is another critical factor that directly impacts prediction accuracy. For wheat, the best results come from flights during the flowering and grain-filling stages. Corn yields are most accurately predicted with mid-season imagery, though data collected at the vegetative (V6) or reproductive (R5) stages can also be effective. Soybeans require flights approximately 25 days after emergence, at the V4 stage, while rice benefits from imagery taken during panicle initiation. A multi-temporal approach, which involves capturing imagery at multiple growth stages, provides more stable predictions by accounting for changes in crop development.
Combining different data types is where UAV-based yield prediction really shines. Integrating spectral indices with texture and geometric data, such as plant height, significantly improves model accuracy. As Jianghao Yuan from the College of Information Science & Technology explains:
"The optimal yield estimation model may vary depending on the selected features and the period of data collection, but random forest and convolutional neural networks still perform the best in most cases".
When it comes to sensors, multispectral cameras outperform RGB cameras thanks to their ability to capture red-edge and near-infrared (NIR) data. However, RGB cameras remain a budget-friendly option for capturing shape and color information. Blending these elements - indices, models, timing, and sensor capabilities - creates a reliable framework for UAV-based yield prediction.
Anvil Labs and UAV Data Integration
Handling massive UAV datasets for yield prediction requires a platform tailored for agricultural spatial data, and that's where Anvil Labs steps in. It specializes in hosting and processing key data types - like orthomosaics, LiDAR point clouds, and thermal imagery - necessary for accurate yield forecasting across crops such as wheat, corn, rice, soybeans, cotton, peanuts, and sugarcane.
The platform ensures data accuracy through geometric and radiometric calibration, addressing inconsistencies caused by changing light conditions and sensor drift. Once the data is calibrated, it’s processed into formats optimized for advanced AI analysis, making it ready for feature extraction and further study.
Anvil Labs integrates seamlessly with AI tools that support Random Forest and CNN models, both of which are trusted for yield estimation. Agronomists can use its annotation and measurement tools to calculate over 55 vegetation indices - like NDVI, NDRE, and SAVI - directly from the hosted orthomosaics. When paired with LiDAR-derived plant height data, these indices enhance prediction accuracy. Additionally, thermal imagery helps identify water stress in crops like cotton and rice, providing insights for better irrigation planning.
To boost model reliability, Anvil Labs includes spatial cross-validation, which ensures realistic performance assessments. For example, research from the Area X.O smart farm in Ottawa, Canada, highlighted a significant difference in corn yield model accuracy: a correlation coefficient of 0.81 with standard 10-fold cross-validation dropped to 0.39 when spatial cross-validation was applied. This realistic approach avoids overly optimistic predictions, reducing costly errors when scaling to new farms.
The platform's secure sharing and access controls make collaboration between agronomists, data scientists, and farm managers straightforward. Whether analyzing mid-season corn data or monitoring wheat during the grain-filling stage, Anvil Labs organizes multimodal datasets and keeps them accessible across devices. By turning raw UAV flights into actionable yield forecasts, it empowers users to make informed decisions with confidence.
Conclusion
Using UAVs for yield prediction is changing the game for crop management. These tools enable early-season forecasts for crops like wheat, peanuts, corn, rice, soybeans, cotton, and sugarcane, helping farmers optimize trade planning, streamline operations, and shape better agricultural policies. Instead of managing fields as uniform plots, UAVs allow the creation of precise yield maps that account for field variability. This approach reduces costs for fertilizers, water, and pesticides while increasing overall productivity.
UAVs provide a major advantage by monitoring crops without the need for heavy machinery or manual sampling. They capture incredibly detailed variations at resolutions between 0.7–3.9 cm, far surpassing the capabilities of satellites. Plus, UAVs can be deployed on-demand and operate effectively even in cloudy conditions, sidestepping the limitations of satellite revisit schedules. Field studies consistently back up these benefits, showcasing high accuracy in yield predictions.
"UAV-based remote sensing technologies are emerging as a transformative solution, offering a financially viable and technologically advanced alternative to traditional, resource-intensive crop monitoring approaches." - Singh et al.
Real-world examples highlight these advancements. At the Area X.O smart farm in Ottawa, Canada, during the 2021 growing season, Patrick Killeen and his team from the University of Ottawa used UAV multispectral imagery to predict corn yields. Their work achieved a correlation coefficient of 0.81 by applying Random Forest models. Similarly, in Pori, Finland, researchers from Mtech Digital Solutions Oy monitored 85 hectares across nine fields in 2018. They utilized 3D-CNN models with UAV time-series data, achieving a mean absolute percentage error of just 5.51%.
For farmers embracing these technologies, platforms like Anvil Labs simplify the entire process. They support tasks like hosting orthomosaics and LiDAR point clouds and integrating AI tools for feature extraction and spatial cross-validation. By turning UAV data into actionable yield insights, these tools enable growers to make smarter decisions, boost productivity, cut waste, and enhance food security - critical goals in a world facing growing demand for resources.
FAQs
What UAV sensor should I use: RGB, multispectral, or LiDAR?
When selecting a sensor for crop monitoring, it all comes down to your specific goals:
- RGB sensors: Perfect for creating visual maps and spotting variability in your fields.
- Multispectral sensors: These are excellent for evaluating crop health and estimating yield, as they capture data that highlights plant stress.
- LiDAR sensors: Best suited for 3D modeling and estimating biomass, providing detailed structural insights.
Each sensor serves a distinct purpose - RGB for visuals, multispectral for health and yield insights, and LiDAR for structural analysis.
How many flights per season do I need for accurate yield prediction?
The number of flights required varies depending on the type of crop and the specifics of the study. Typically, multiple flights are ideal to capture the different growth stages effectively. For instance, corn might warrant flights during important stages such as V4, V6, V8, or V10, while wheat may require a different schedule. Flying at these critical moments helps improve accuracy by factoring in the natural variations in crop development over time.
How do I validate yield models so they work on new fields?
To ensure your yield models perform well in new fields, try spatial cross-validation. This involves splitting your dataset into separate regions, training the model on one area, and testing it on another. This approach helps verify that the model can handle data from different locations effectively.
To make your model stronger, include multi-temporal imagery and a variety of environmental metrics. These additions can provide a broader perspective and improve reliability. Also, keep the model current by regularly updating it with fresh data and testing its accuracy. This practice helps maintain dependable performance, even in changing conditions.
