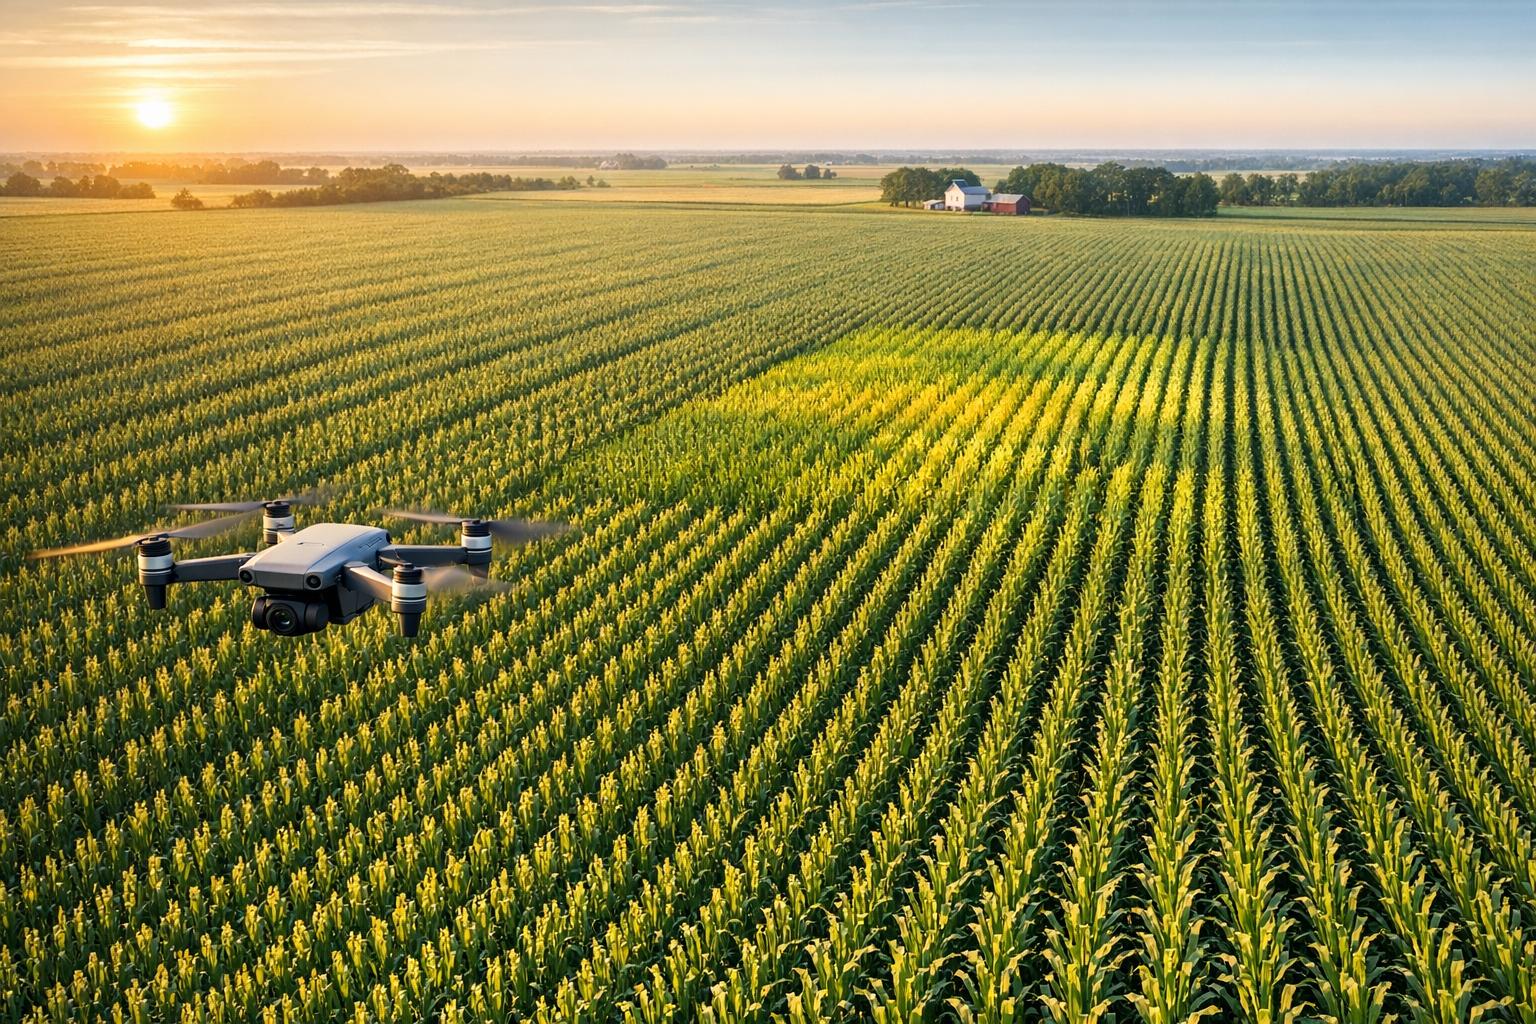
Remote sensing helps farmers spot crop diseases before visible symptoms appear, saving yields and reducing costs. By using drones, satellites, and advanced sensors, subtle plant stress signals can be detected early, allowing precise interventions. Here's how it works:
- Sensors detect stress early: Multispectral, hyperspectral, and thermal sensors identify changes in plant health that aren't visible to the naked eye.
- Targeted action saves resources: Early detection allows farmers to treat only affected areas, cutting down on fungicide use and costs.
- AI improves accuracy: Machine learning models analyze data to identify disease patterns, sometimes up to 7 days before symptoms show.
- Drones and satellites work together: Satellites provide wide coverage, while drones offer detailed inspections for precise disease management.
This technology not only protects crops but also helps address global food security challenges, making farming more efficient and precise.
【Remote Sensing】Crop Disease Detection Using UAV and Deep Learning Techniques
Step 1: Choose the Right Remote Sensing Tools
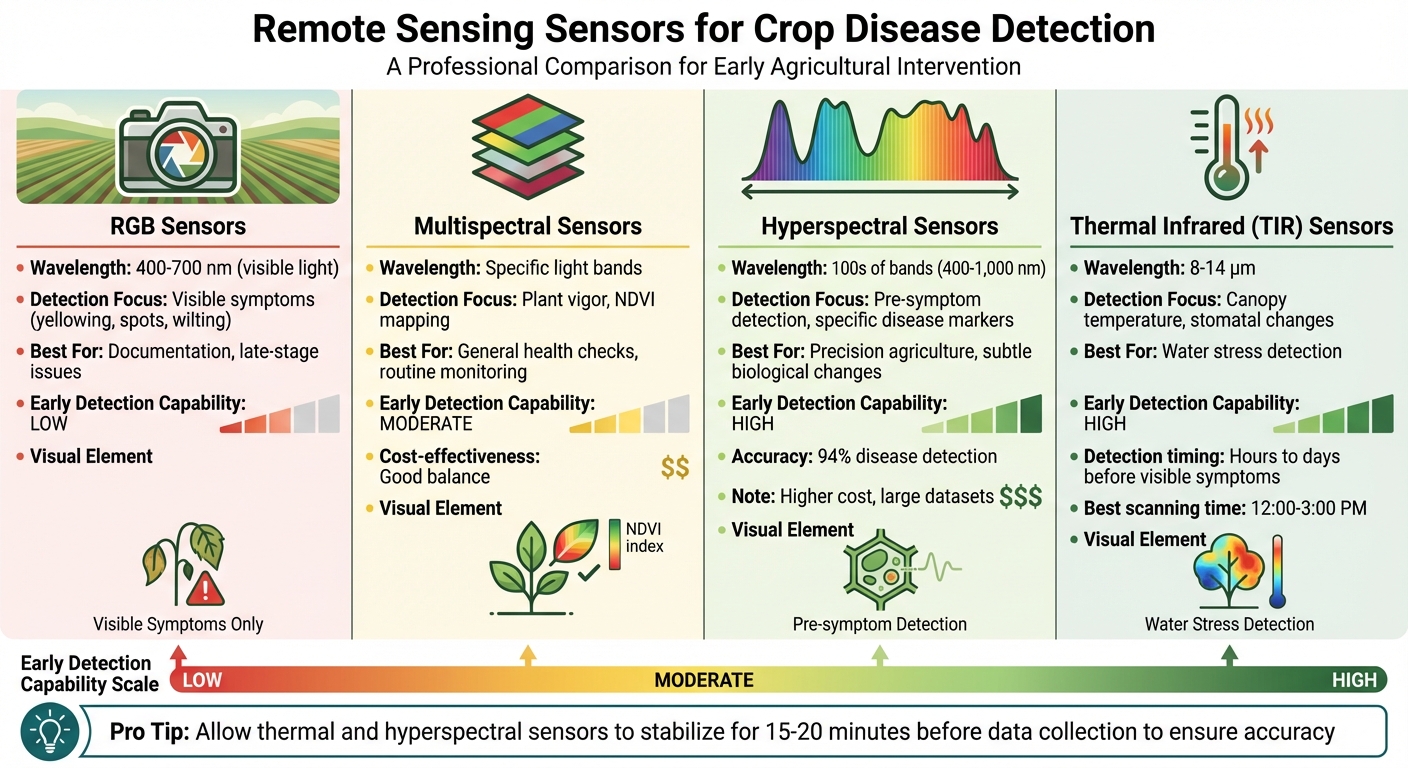
Remote Sensing Sensor Types for Crop Disease Detection Comparison
Picking the right sensors is essential for spotting crop diseases early. Different sensors excel at detecting specific types of plant stress, so understanding what they do can help you create a solid monitoring system.
Types of Sensors Used in Agriculture
RGB sensors work like your smartphone camera, capturing visible light (400–700 nm). They’re great for spotting visible problems like yellowing leaves, spots, or wilting[2,9].
Multispectral sensors capture specific light bands that are used to calculate vegetation indices like NDVI, which assess plant health and stress patterns. These sensors strike a balance between cost and capability, making them ideal for routine monitoring[2,4].
Hyperspectral sensors take things up a notch by detecting diseases before you can see any symptoms. They identify subtle biological changes in a plant’s spectral signature. While they’re pricier and produce large datasets, the ability to catch issues early is a major advantage. As Abhilash Chandel, an Assistant Professor and Extension Specialist at Virginia Tech, explains:
"Conventional disease assessment techniques are inadequate, spatially inaccurate, and expensive... appearance of symptoms is often an indication that it is already too late to avoid yield losses".
Thermal infrared (TIR) sensors measure canopy temperature in the 8–14 μm range. When plants are stressed, they close their stomata, causing leaf temperatures to rise - often hours or even days before visible symptoms appear. To get the best results, schedule thermal scans in the early afternoon (12:00–3:00 PM) when the link between canopy temperature and soil moisture is strongest.
| Sensor Type | Detection Focus | Best For | Early Detection? |
|---|---|---|---|
| RGB | Visible symptoms (400–700 nm) | Documentation, late-stage issues | Low |
| Multispectral | Plant vigor across key light bands | General health checks, NDVI mapping | Moderate |
| Hyperspectral | Specific disease markers (100s of bands) | Pre-symptom detection, precision | High |
| Thermal | Canopy temperature (8–14 μm) | Water stress, stomatal changes | High |
Before collecting data, let thermal and hyperspectral sensors stabilize for 15–20 minutes to avoid temperature drift and ensure accuracy.
With your sensors ready, combining aerial platforms like drones and satellites can take your disease detection to the next level.
Combine Drones and Satellites for Data Collection
After selecting your sensors, integrate multiple data sources to get a full picture of your fields. Drones and satellites complement each other perfectly. Satellites offer wide coverage, imaging your entire farm several times a week. Modern satellites can pinpoint anomalies with resolutions as fine as 10 feet, which can then guide targeted drone inspections.
Once satellites flag an issue, drones can zoom in for a detailed look. Drones provide resolutions down to millimeters or centimeters and can scan a 160-acre field in under 15 minutes. They’re especially helpful later in the season when crops grow too tall and dense for ground scouting.
A great example of this workflow comes from a 2020 project by Corteva Agriscience in Ohio. Satellite imagery from Granular Insights revealed poor crop health in one corner of a cornfield. The team followed up with a DroneDeploy mapping mission, and ground scouting - guided by the drone data - confirmed corn rootworm damage. This layered approach saved time and resources by focusing efforts where they were needed most.
When flying drones over fields with elevation changes greater than 33 feet (10 m), use the "terrain following" mode to maintain consistent Ground Sampling Distance (GSD) across the field. If you’re using multiple sensors with different resolutions, set your flight altitude based on the lowest-resolution sensor to ensure the data aligns properly.
Step 2: Collect and Process Data
Once you've selected your sensors and data sources, the next step is turning raw data into meaningful insights. This involves careful flight planning and detailed spectral analysis.
Plan Data Collection Flights
To ensure precise data collection, use automated flight planning tools like Pix4Dcapture or DroneDeploy. These platforms help you map out flight paths, set altitudes, and optimize your coverage. Flight altitude plays a key role in determining Ground Sampling Distance (GSD). For instance, flying at lower altitudes can provide detailed resolutions as fine as 0.3 inches per pixel, but it comes with a trade-off - higher battery consumption.
Timing is also critical. Schedule your flights around solar noon on clear days to minimize shadows and maintain consistent lighting across the field. This approach helps reduce variations caused by the Bidirectional Reflectance Distribution Function (BRDF).
For smooth image stitching, ensure at least 70% overlap in all directions. To improve the accuracy of your reflectance data, place calibration panels in the field before the flight. These panels help adjust for sunlight variations, ensuring your sensor readings are as accurate as possible.
A practical example comes from a 2020 study at the University of Minnesota Rosemount Research Outreach Center. Researchers used a hyperspectral camera mounted on a DJI Matrice 600 Pro, flying at an altitude of 66 feet (20 meters) over 960 wheat plots. The result? Images with a pixel resolution of 1.2 inches (3 cm).
Analyze Vegetation Indices
Once you've collected your images, the next step is processing them into vegetation indices, which are essential for assessing plant health. One widely used index is the Normalized Difference Vegetation Index (NDVI). Calculated as (NIR – Red) / (NIR + Red), NDVI values range from –1 (indicating water) to +1 (indicating optimal greenness). This index is great for identifying spatial variability and monitoring overall crop vigor.
However, NDVI has its limitations. In dense or mature crops, it can saturate, making it less effective. For these scenarios, the Normalized Difference Red Edge (NDRE) is a better choice. NDRE leverages the red-edge spectrum, allowing it to detect stress in crops even at later growth stages or in dense canopies.
For even more precision in high-biomass conditions, consider the Wide Dynamic Range Vegetation Index (WDRVI). This index uses a weighting factor (commonly α = 0.2) applied to the NIR reflectance, making it sensitive to subtle changes that NDVI might overlook. Additionally, thermal infrared (TIR) sensors can measure canopy temperature, providing early detection of water stress - often before visible symptoms appear.
| Vegetation Index | Formula | Best Use Case |
|---|---|---|
| NDVI | (NIR - Red) / (NIR + Red) | General crop health and early growth monitoring |
| NDRE | (NIR - RedEdge) / (NIR + RedEdge) | Late-season or dense canopy stress detection |
| WDRVI | (α × NIR - Red) / (α × NIR + Red) | High-biomass conditions requiring subtle change detection |
To make the most of your data, you'll need to process raw sensor readings with radiometric correction, georeferencing, and reflectance conversion. Then, use Structure-from-Motion (SfM) algorithms to stitch overlapping images into a single high-resolution orthomosaic. This allows for detailed analysis, such as identifying disease patterns in your crops.
With these refined vegetation indices, you're ready to apply AI tools to detect and analyze disease trends effectively.
sbb-itb-ac6e058
Step 3: Use AI for Disease Detection
With vegetation indices prepared, AI steps in to identify the early stages of disease. By analyzing these indices, AI can detect subtle, pre-symptomatic changes in crops - sometimes up to 7 days before visible symptoms appear.
Train Models to Recognize Disease Patterns
Modern AI systems combine advanced architectures to improve detection accuracy. For example, Convolutional Neural Networks (CNNs) focus on spatial details, while Transformers analyze patterns across entire fields. These models rely heavily on spectral signature analysis, as each disease leaves a distinct reflectance pattern.
Take powdery mildew, for instance: its light fungal coating reflects 60–80% of light, whereas loose smut, with its dark spores, absorbs most radiation, reflecting only 7–10%. AI learns these patterns to differentiate between diseases automatically.
In 2025, researchers at Toraighyrov University created a spectral library for wheat diseases. Using a Random Forest algorithm on hyperspectral data (spanning 400–1,000 nm), they achieved an impressive 94% accuracy in disease detection. Similarly, a 2023 study by the University of Minnesota used Random Forest and Support Vector Machine algorithms to classify wheat stem rust into four severity levels. Their models reached 88% accuracy in distinguishing mildly diseased plants from healthy ones.
Tools like Grad-CAM (Gradient-weighted Class Activation Mapping) provide visual insights by generating heatmaps. These heatmaps highlight the exact areas of a plant that the AI identifies as diseased, giving agronomists actionable information to guide their decisions.
These trained and tested models are already finding practical applications in the field.
Real Applications of AI in Crop Health Management
AI is transforming how crop health is managed in real-world scenarios. For example, in September 2020, researchers from NASA's Jet Propulsion Laboratory and Cornell University used the AVIRIS-NG airborne instrument to monitor 205 acres (83 hectares) of Cabernet Sauvignon vineyards in Lodi, California. Their Random Forest models identified Grapevine Leafroll-associated Virus Complex 3 (GLRaV-3) with 87% accuracy, even in asymptomatic vines - detecting infections a full year before symptoms became visible. This is a game-changer for the U.S. wine and grape industry, which loses $3 billion annually to viral diseases like GLRaV-3.
"The importance of invisible wavelengths suggests that this capacity is driven by disease-induced changes to plant physiology." - Fernando E. Romero Galvan, Cornell University
In early 2025, researchers introduced "AgroVisionNet", a hybrid CNN-Transformer model deployed on an NVIDIA Jetson Nano. This system, built with TensorFlow Lite, used high-resolution drone imagery combined with real-time IoT sensor data (temperature, humidity, soil moisture) to detect crop diseases during drone flights. By processing data on-site instead of uploading it to cloud servers, this approach allows for immediate intervention.
To improve detection, techniques like the Synthetic Minority Oversampling Technique (SMOTE) are used to balance datasets, as healthy plant samples often outnumber diseased ones significantly. Additionally, focusing on specific indices such as the Photochemical Reflectance Index (PRI) and Red-Edge Vegetation Stress Index (RVSI) enhances sensitivity to early physiological changes.
Step 4: Visualize and Act on Data
After AI identifies disease patterns, the next step is to turn raw data - like hyperspectral images, thermal scans, and LiDAR - into actionable insights. The key is to process and visualize this data in ways that allow for quick, informed decisions in the field. Without this step, the valuable information gathered risks being underutilized.
Upload and Manage Data on a Centralized Platform
Once processed, imagery and data need a secure, centralized platform for storage and easy access. Platforms such as Anvil Labs are designed to host orthomosaics, thermal imagery, and LiDAR datasets, simplifying management for agronomists. Instead of juggling multiple file systems or cloud platforms, users can access everything in one place - whether they’re in the office or out in the field. Drone imagery, with its high resolution, plays a major role in offering precise insights.
Orthomosaics in RGB color provide clear, detailed visuals that make it easy to spot issues like crop gaps, maturity levels, or visible stress areas. Vegetation index maps, such as NDVI or NDRE, take it a step further by assigning numerical values to plant health - higher numbers mean healthier plants, while lower ones signal stress or disease. Digital Surface Models (DSM) add even more depth, mapping out field elevation to pinpoint drainage issues that might lead to soilborne diseases.
By centralizing this data, teams not only ensure its preservation but also enable seamless collaboration, allowing everyone to work with the same up-to-date information.
Use Tools for Collaboration and Actionable Insights
Visualization is just the beginning. To make real progress, teams need tools that allow for annotations, measurements, and targeted actions. For example, GPS-guided scouting helps teams focus on high-stress zones, cutting down the time and effort needed for field inspections. Research shows that with the right software, an agronomist can survey a 160-acre field in under 15 minutes to identify variations in plant health.
Thermal analysis is another powerful tool, detecting water stress or biological changes before they’re visible to the naked eye. This allows teams to act quickly, prioritizing fields that need immediate attention. Some platforms even come with features like "Scout Priority" rankings, which automatically flag fields experiencing the most critical changes. Weekly updates ensure teams stay informed and ready to respond.
For even greater precision, data can be converted into zone-based prescription maps. These maps are compatible with modern tractor retrofits and drone sprayers, enabling targeted application of treatments like fungicides or fertilizers. Instead of treating an entire field, resources are directed only to affected zones, saving money and reducing waste while ensuring crops get the protection they need.
"Visible disease symptoms are often confused with other types of stressors... visual scouting can be very subjective, prone to prejudice, and can be masked depending on environmental conditions." - Abhilash Chandel, Assistant Professor and Extension Specialist, Virginia Tech
Conclusion: Transform Agriculture with Remote Sensing
As discussed, choosing the right sensors, collecting accurate data, and leveraging AI analysis are key elements driving this approach forward.
Remote sensing is changing the game in crop protection. It can detect diseases before any visible symptoms appear, preventing yield losses that could reach up to 90%. By identifying stress at a physiological level, farmers gain a crucial opportunity to apply precise treatments, ensuring their harvests remain secure.
Using zone-based prescription maps, growers can treat only the areas that need attention, cutting costs and reducing environmental impact. Drones further enhance this process by quickly surveying fields and enabling targeted interventions. This speed and precision help tackle labor shortages while removing much of the guesswork traditionally tied to scouting.
"Remote sensing has emerged as a transformative tool for plant disease monitoring, offering early detection, wide coverage, and data-driven insights for precision agriculture." - Isabella Lopez, Department of Plant Physiology, California Institute of Technology
Another advantage is streamlined data management. Hyperspectral and thermal sensors generate large datasets, which require a centralized platform to handle orthomosaics, LiDAR, and thermal imagery. Anvil Labs provides such a solution - a secure platform where agronomists can upload, analyze, and collaborate on spatial data. With tools for annotations and measurements, teams can mark problem areas, share insights instantly, and translate findings into GPS-guided actions in the field.
This combination of efficient data handling and actionable insights is shaping the future of farming. Remote sensing, paired with AI and centralized platforms, empowers farmers to protect yields, cut costs, and adopt practices that are better for the planet - all while preparing to meet the needs of a global population projected to surpass 9 billion by 2050.
FAQs
How do drones and satellites work together to detect crop diseases early?
Drones and satellites work together effectively by leveraging their distinct capabilities to monitor crop diseases on various scales. Satellites excel at providing a large-scale view, allowing farmers to observe entire regions over time and identify early signs of disease stress across vast fields.
Drones, in contrast, specialize in zooming in on specific areas with incredible detail. This close-up perspective helps assess the severity and spread of diseases with precision. Satellites act as an early warning system, while drones deliver the focused data needed to make targeted decisions. By combining these tools, farmers can spot issues sooner and manage crop health more effectively.
How does AI improve the accuracy of remote sensing in detecting crop diseases?
AI has transformed how we use remote sensing to spot crop diseases, especially through its ability to analyze aerial images with computer vision. These tools can identify early signs of disease that human eyes might miss, giving farmers a crucial head start.
On top of that, machine learning algorithms like random forests and support vector machines play a big role in classifying diseases and evaluating their severity. By handling massive datasets swiftly and precisely, AI empowers farmers to take action sooner, minimizing crop damage and boosting overall yields.
Why are hyperspectral sensors worth the investment for early crop disease detection?
Hyperspectral sensors are powerful tools for spotting crop diseases early. They work by analyzing light across a broad spectrum of wavelengths, allowing them to pick up on subtle changes in plant health. These changes might include shifts in chlorophyll levels, water content, or even the structure of plant cells - factors that often signal the onset of disease.
Although these sensors can come with a higher price tag, their performance speaks for itself. With detection accuracies ranging from 60% to 90% - and sometimes exceeding that - they offer farmers a way to stay ahead of potential problems. By catching diseases early, farmers can act quickly, protecting their crops and minimizing potential losses.
